
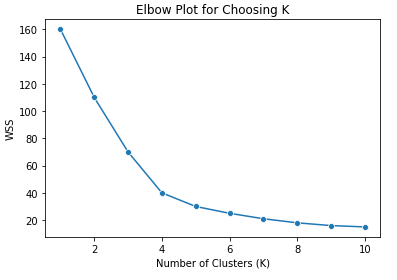
The most common way to choose k is to run the algorithm over a range of values and then plot the within-cluster sum of squares, or a similar evaluation metric, against the values of k. While the within-cluster sum of squares will monotonically decrease as k gets larger, there is usually a point where an elbow-like pattern appears, indicating that increasing k beyond that point produces diminishing returns. This is analogous to overfitting in supervised learning. In the example elbow plot below, k=4 would be the best choice, since the magnitude of decrease in WSS beyond 4 clusters diminishes compared to that up to 4.
How can you choose the optimal value for ‘k’ in K-Means?
Help us improve this post by suggesting in comments below:
– modifications to the text, and infographics
– video resources that offer clear explanations for this question
– code snippets and case studies relevant to this concept
– online blogs, and research publications that are a “must read” on this topic
Partner Ad
