
Related Questions:
– What is the difference between Mean, Median and Mode?
The median and mean are both measures of central tendency, but they have different strengths and weaknesses, and one may be more appropriate than the other depending on the distribution of the data and study goals.
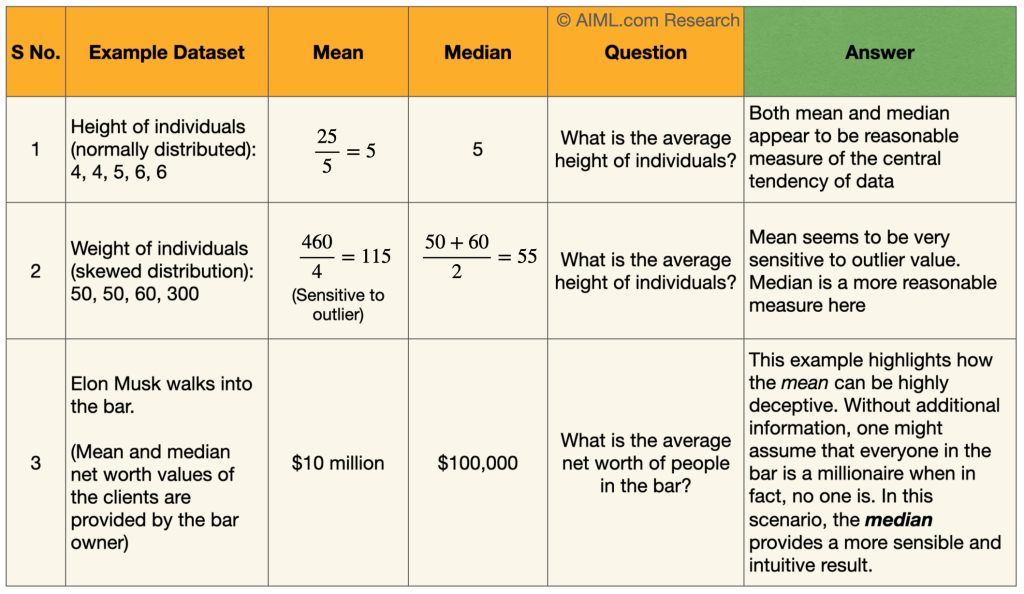
The median is a good measure of central tendency when the data is skewed or has extreme values (outliers) that can influence the mean. In these cases, the median provides a better representation of the typical value of the data. On the other hand, the mean is a good measure of central tendency when the data is roughly symmetrical and has a bell-shaped distribution, such as the normal distribution. In these cases, the mean provides a good representation of the average value of the data.
Examples:
In addition to the above criteria, it is also important to keep sight of the goal of the analysis while deciding on summary statistic especially in scenarios when the distribution is not normal. In a skewed distribution, it is important to understand the reason behind outliers – whether an outlier is due to measurement error or is it a valid data point? In the case of a measurement error, outlier can be completely ignored and excluded from analysis. However, if it is a valid expected data point, the outlier should be handled with caution. In such scenarios, choosing between mean and median might not be very straight forward and this is where it is crucial to understanding the decision goals when referring to average values.
Examples:
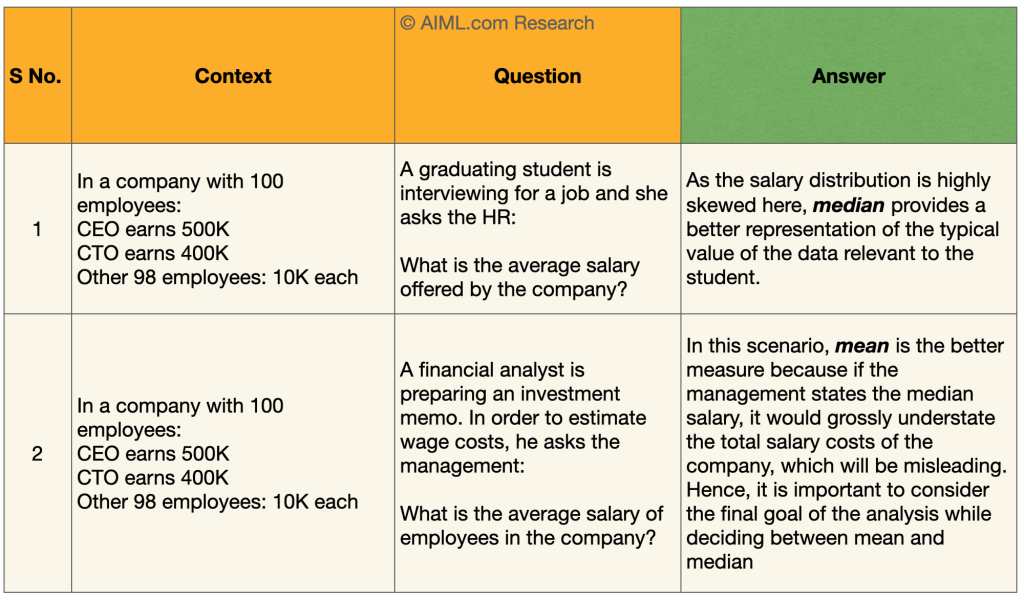
In summary, the choice between the median and mean as a measure of central tendency depends on the distribution of the data and the presence of outliers. Typically, the median is better suited for skewed data, while the mean is better suited for symmetrical (normally distributed) data. In addition to the above, it is also important to keep the decision goals in mind while deciding on summary statistic.
Video explanation
In this video by Math Antics, it explains the ‘why’ behind the usage of central tendency statistics: mean, median and mode and succinctly explains the concepts using real world examples. (Runtime: 11:03 min)
